Electronic Boost Gauge
Posted: Jan Tue 12, 2010 4:06 pm
I've had this built for a while, but I've been slacking getting some pictures posted. (if this is in the wrong spot, feel free to move it Mike).
Rundown:
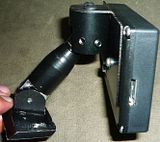
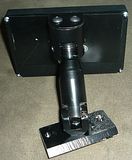
I'm using a Wideband2 to translate my MAP Sensor analog signal into boost (gauge psi). I'm using one of DynoJet's LCD displays to display it.
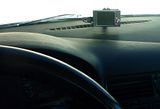
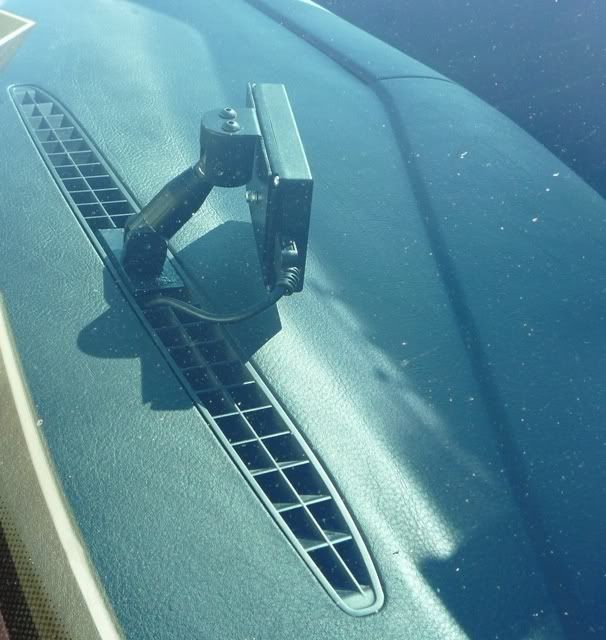
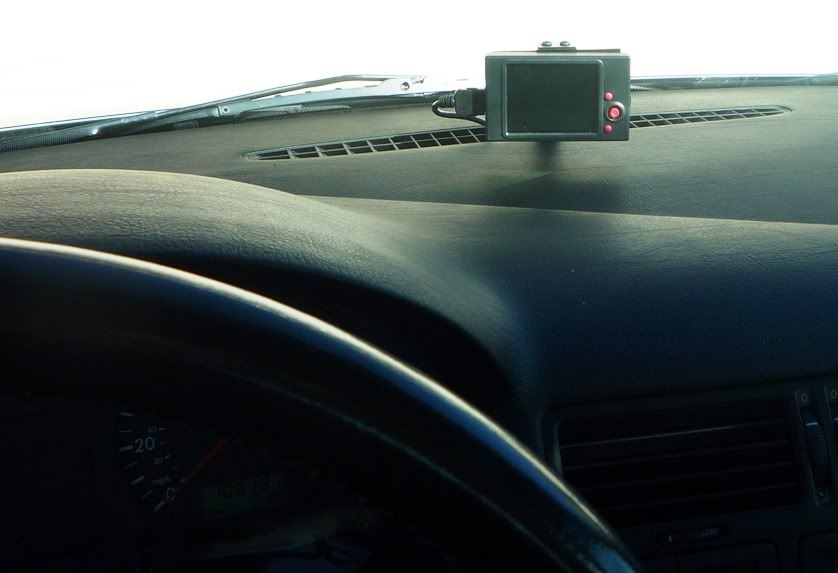
I originally designed and built a gauge mount that goes in the circular vent on the dash near the pillar (G14 classified, so no pics ). I decided I didn't like the idea of it being near the airbag so I built a mount that goes in the middle of the dash on the defroster vent. (I designed and fabricated the whole thing out of aluminum). I need to take it apart and repaint it, but it's been working real nice. Maybe I'll look into getting it anodized (I recall seeing a new member that has everything for that).

short crappy video showing it in playback mode:
[youtube]http://www.youtube.com/watch?v=_WcJRwBZFTE[/youtube]
The feature I like the most about the display is I can data log my boost and export it to excel for graphing and such. I have an EGT probe on hand, so as soon as I get it installed, I'm going to pipe it into the display also. Most likely I'll display EGT as a bar graph or digital readout, but we'll see when I finally get it setup.
I need to do some work on the sample and averaging too, that way I can get a smoother needle sweep.
And if anyone's curious, no I am not running an wideband oxygen sensor on my car. Not really practical on a diesel. I'm simply using the analog input feature on the WB2.
Rundown:
I'm using a Wideband2 to translate my MAP Sensor analog signal into boost (gauge psi). I'm using one of DynoJet's LCD displays to display it.
I originally designed and built a gauge mount that goes in the circular vent on the dash near the pillar (G14 classified, so no pics


short crappy video showing it in playback mode:
[youtube]http://www.youtube.com/watch?v=_WcJRwBZFTE[/youtube]
The feature I like the most about the display is I can data log my boost and export it to excel for graphing and such. I have an EGT probe on hand, so as soon as I get it installed, I'm going to pipe it into the display also. Most likely I'll display EGT as a bar graph or digital readout, but we'll see when I finally get it setup.
I need to do some work on the sample and averaging too, that way I can get a smoother needle sweep.
And if anyone's curious, no I am not running an wideband oxygen sensor on my car. Not really practical on a diesel. I'm simply using the analog input feature on the WB2.